My team has been trying to modernize pandas from a different tact. Regardless of struggle with the syntax, it seems Pandas is very sticky, and we don't predict much migration to other data science languages. Instead of refining the syntax, we have combined it with a spreadsheet GUI (https://github.com/mito-ds/monorepo). Here, we worry less about writing perfect syntax ourselves, and let the GUI write the code for functions like pivot tables and merges that work well visually.
I think this is spot on. I agree that Excel users want to stick with Excel, but they do run into major issues that are solved by code. Namely: their data size is too large, Excel is too slow, and they struggle to get repeatability from their work.
I am building Mito[1], a spreadsheet interface for Python. Every edit you make in the spreadsheet generates the equivalent Python. It is a bridge between the workflows of Excel users and Python users, and allows Excel users to reap Python's benefits without needing to know how to code.
Spreadsheets versus programmers is a war that can be much more peaceful. In my work, I have found that, especially in data science, the spreadsheet user and the programmers are often trying to accomplish similar tasks, but the “language barrier” between them leads to much more fragmented workflows. I also think this article does a good job of identifying spreadsheets as a low-code programming language — spreadsheets are immensely powerful pieces of software. Along these lines — I’ve been building Mito (https://trymito.io/), a spreadsheet GUI for Python. Every edit you make in the spreadsheet generates the equivalent Python code.
Spreadsheet users are programmers. Shouldn't be a war.
But, the problem with spreadsheets is that they are an engine of shoddy programming. I don't think it's fundamental. All currently existing spreadsheet implementations hide their functions and make review difficult. If we had spreadsheets that somehow exposed the relations between the cells and made them easier to inspect, ideally minimizing selective interaction (obviously you can mouseover, but that is a far more selective interaction than scrolling a file), they would be less of a problem.
To some degree notebooks (matlab/mathematica/octave, jupyter, pluto, livebook) are solving this problem, and probably being "halfway-between" spreadsheets code, with being fully reviewable is a game-changer, why data scientists like them.
I think you could also improve on the spreadsheet in other ways by being more opinionated. You could have each table be a named entity not on an "infinite-plane of cells" (so you have to set the # of rows and columns, obviously should still be easy to insert/remove rows and columns). I am sure I am not alone in thinking for the last 3 decades that graphs just "hanging out in the middle of the cells" is really stupid.
I agree with the your statements. Would add that it is important to understand most developers of spreadsheets have never taken a programming class and do not fully understand many of the issues discussed in this thread.
Also, there is little motivation to the spreadsheet user to change. In the examples given by the author, the original creator of the spreadsheet is long gone by the time the problems surface.
The cynic in me says that sometimes there is business value to keeping formulae away from review. When the regulators come knocking you get plausible deniability for "mistakes" and at least avoid treble damages.
What is especially ironic is that excel is not so straighforward to use in my experience. If you want to do something in excel that you don't know how to do, you are best off finding a search engine and looking for a 5 minute article that explains everything. Now, programming is seen as toohard for some reason, but if you were to look for how to do that exact same merge or join or barplot or whatever in, say, python or R, I bet it would be another 5 minute article no longer than the excel one. It begs the question, why use excel at all when the learning curve isn't any easier than learning a few functions in python or R? The answer in my opinion is only that its entrenched and familiar, and you have entire companies basing everything on their excel spreadsheets since 1995 because they were told then by advertisers that this is how business should be done on computers. And now we have generations of accountants and business majors going through undergrad and spending braincells and tuition dollars for coursework on the shitware that is excel, rather than learning something like R or python that they could use to create an infinite number of innovative or creative things beyond just parsing a spreadsheet.
> "why use excel at all when the learning curve isn't any easier than learning a few functions in python or R?"
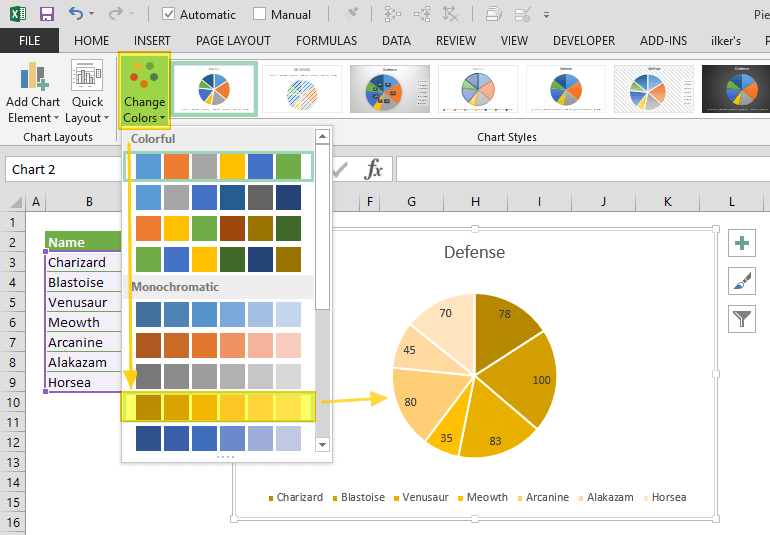
It has a GUI.
Click on a picture of a pie chart[1] is enormously easier than[2]:
    from matplotlib import pyplot as plt

    # Pie chart, where the slices will be ordered and plotted counter-clockwise:
    Aus_Players = 'Smith', 'Finch', 'Warner', 'Lumberchane'
    Runs = [42, 32, 18, 24]
    explode = (0.1, 0, 0, 0)  # it "explode" the 1st slice

    fig1, ax1 = plt.subplots()
    ax1.pie(Runs, explode=explode, labels=Aus_Players, autopct='%1.1f%%',
            shadow=True, startangle=90)
    ax1.axis('equal')  # Equal aspect ratio ensures that pie is drawn as a circle.

    plt.show()
And (clicking a couple of times) includes: no strings, no integers, no method calls, no named parameters, no numeric formating domain-specific-languages, no libraries, no imports, no tuples, no lists, no braces, no parens, no case-sensitivity, no symbols, no text, no writing, no syntax errors, no saving and running cycle, no having to hold the cell order and positions in your head and count through them to get to Runs[2], no trying to get the image out of the show() popup.
And includes: previews of the available charts, recommended charts, all the styles of chart work through the same UX without having to care how they are named, they popup Wizard dialogs so you don't have to read in advance what parameters are required and what they mean, in-line editing by clicking and dragging to move and resize the whole thing or almost any part of it, change the chart style without having to rewrite code differently, rewrite e.g. axis labels without having to save/run, choosing colours and styles from visual dropdowns, having the chart redraw dynamically as you change the data in the source cells, works in Excel online, works with multiple people having the spreadsheet open, chart is inline with your data in the same worksheet saved with it.
I have been working on this problem for a little while. I don't think the issue is that Excel is inherently worse for data wrangling -- it just isn't scalable or easily traceable. My solution is a spreadsheet extension for Jupyter Notebooks, that lets you transform your data visually and outputs the equivalent Pandas.
Automated data prep/transformation is definitely a useful solution, and obviously is going to be a part of most data wrangling tools in the future. I think the danger is a lack of visibility and tracing, something a combo between spreadsheets and pandas provides well -- I think :)
Like to suggest adding to the page title on the homepage - maybe even just 'data python spreadsheets jupyter' -
when went to bookmark I noticed it only had 'mito' in the name.. so if I go back like 3 weeks from now to my bookmarks or whatever and type spreadsheets jup - maybe your thing would not show up (?)
Maybe I'm wrong - I have yet to do a deep dive on what data firefox indexes when I bookmark things.
I used to work for a company making a bet against live collaboration in spreadsheets. I now see the error in my ways. A spreadsheet party in Excel would just be a nightclub that one person can enter at a time.
Office 365 online has a pretty decent multiplayer Excel setup - it has limitations but in general it works pretty well. Great for document reviews/edits (works for Word and Powerpoint as well).