> Most people are barely getting 1% annual raises which means income increases by 138% over the same period.
Where is that 1% coming from? It seems to me US salaries growth pretty much followed 3/5% average for the last 50 years, with some obvious drawdowns during crises.
> In the last 4 decades wages have barely increased, but major assets like cars and houses are 8-10x what they used to be.
That doesn't make any sense. The price of a good should roughly follow an optimum of supply and demand. There is of course a spectrum in which it can oscillate, but your "barely increased" versus "8-10x" comparison is ridiculous.
Things are evolving inside a pretty much closed system. Of course that's not exactly true, especially with capital movements, and mondialisation, but the ballpark should be there. You cannot take conclusions if you don't study the full picture.
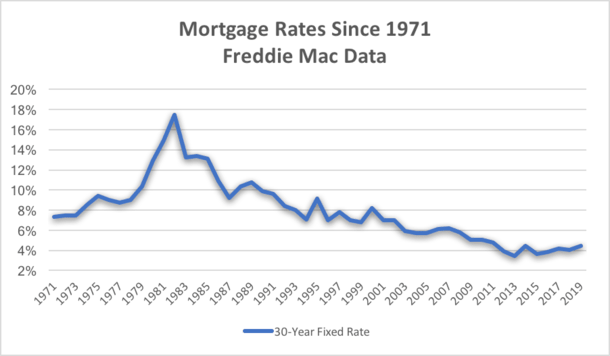
Take housing prices for instance. The main driver for real estate is not some conspiracy of evil super wealthy people. It's just the interest rates. If interest rates lower, then borrowing money is cheaper, people get bigger mortgages, which in turn inflates real estate prices.
> From 1984 to 2016 housing prices in the Greater Vancouver area have gone up 800% [1].
Real estate cannot be studied in geographical isolation. There are way too much factors that can cause local inflation. In the case of Vancouver's real estate, it is notoriously the flow target of a lot of Asian capital. I don't think that should be taken as an example.
That is almost exactly an increase of 8X, compared to roughly 1.5X for personal income. Do you think an increase of 1.5X over forty years or so counts as "barely increased"?
Of course household income is higher because most households have two wage earners instead of one. But that's still around 3X to around 8X.
And the standard deviation for property prices has increased hugely.
This has nothing to do with supply and demand and everything to do with the difference between an unproductive rent seeking economy which sweats static assets - including the workforce - and a productive creative economy driven by innovation and invention.
For all the rhetoric, the current economy has a lot more of the former than the latter. And this is only good for a small number of incredibly rich individuals - at the expense (literally) of almost everyone else.
I think these graphs mistakenly compare inflation adjusted wages to unadjusted house price. It also fails to account for increases in house size.
Inflation adjusted cost per square foot is $126 in 1978 and $146 in 2020, about a 16% increase. Inflation adjusted wages over the same years went from 24.5K in '78 to 36K in '19, for about a 46% increase.
According to these stats, housing is actually more affordable for the same home size.
I wonder to what extent homes have increased in size to compensate for the higher price of the land they are built on.
In my neighbourhood over the last ten years small-ish 1-floor homes built in the 70s and 80s have been consistently replaced with 3-story McMansion atrocities.
You can't buy a smaller, cheaper, house because they are not being built, and I suspect the reason I'd that their price per square foot would be sky high due to the cost of the land.
What I am saying is that the price of a good (say, a car) is not decided in a vacuum. It is merely an indirect side effect of the supply and demand optimum.
What that means is that if the price of cars increases, it is a consequence of either consumers being willing/able to pay more for a car (demand driven) or cars being more expensive to build (supply driven). As I mentioned, this is not an absolute truth, since the term structure of the supply demand _could_ change due to external factors. I still mention that in the case of these goods, this is very unlikely.
For housing, the main factors are 1) what the investment will yield (rent expectation) 2) what the investment costs (interest rates).
If any of these factors (rent, IR) changes, it will impact the price.
> Here's a graph of median personal income:
> And here's a graph of median house prices:
You are comparing CPI adjusted versus point in time dollars here...
Is the source taking the average or median for wage growth? I'd expect that the average has gone up because of the insane growth in executive pay. But I'd be interested in seeing the change in the median, which I'm sure is much less than the average.
Where is that 1% coming from? It seems to me US salaries growth pretty much followed 3/5% average for the last 50 years, with some obvious drawdowns during crises.
Source: https://tradingeconomics.com/united-states/wage-growth
> In the last 4 decades wages have barely increased, but major assets like cars and houses are 8-10x what they used to be.
That doesn't make any sense. The price of a good should roughly follow an optimum of supply and demand. There is of course a spectrum in which it can oscillate, but your "barely increased" versus "8-10x" comparison is ridiculous.
Things are evolving inside a pretty much closed system. Of course that's not exactly true, especially with capital movements, and mondialisation, but the ballpark should be there. You cannot take conclusions if you don't study the full picture.
Take housing prices for instance. The main driver for real estate is not some conspiracy of evil super wealthy people. It's just the interest rates. If interest rates lower, then borrowing money is cheaper, people get bigger mortgages, which in turn inflates real estate prices.
> From 1984 to 2016 housing prices in the Greater Vancouver area have gone up 800% [1].
Real estate cannot be studied in geographical isolation. There are way too much factors that can cause local inflation. In the case of Vancouver's real estate, it is notoriously the flow target of a lot of Asian capital. I don't think that should be taken as an example.